Lab 3: Simulation and Testing
0 Introduction
In this lab, you will learn how to simulate your modules and test them in software before pushing them to the board. In the previous labs, you had to push your code through the entire toolchain and impact the bitstream onto the FPGA before you could verify that your design worked. This is feasible for simple designs that can quickly be synthesized and quickly verified on the board, but this approach does not scale. In this lab, you will learn how to simulate a hardware design and write testbenches, both of which are essential in the verifcation process of large and complex systems.
1 Prelab
You may want to get ahead on the lab before scheduled lab hours by writing the required Verilog beforehand. You can simply follow the directions starting from 2.2 Lab Resources.
2 Lab Procedure
In this lab, you will be writing the ALU that you will be using later on for the next lab and your project. You will also be learning techniques for simulating and verifying your design.
2.1 Project Sneak Peak
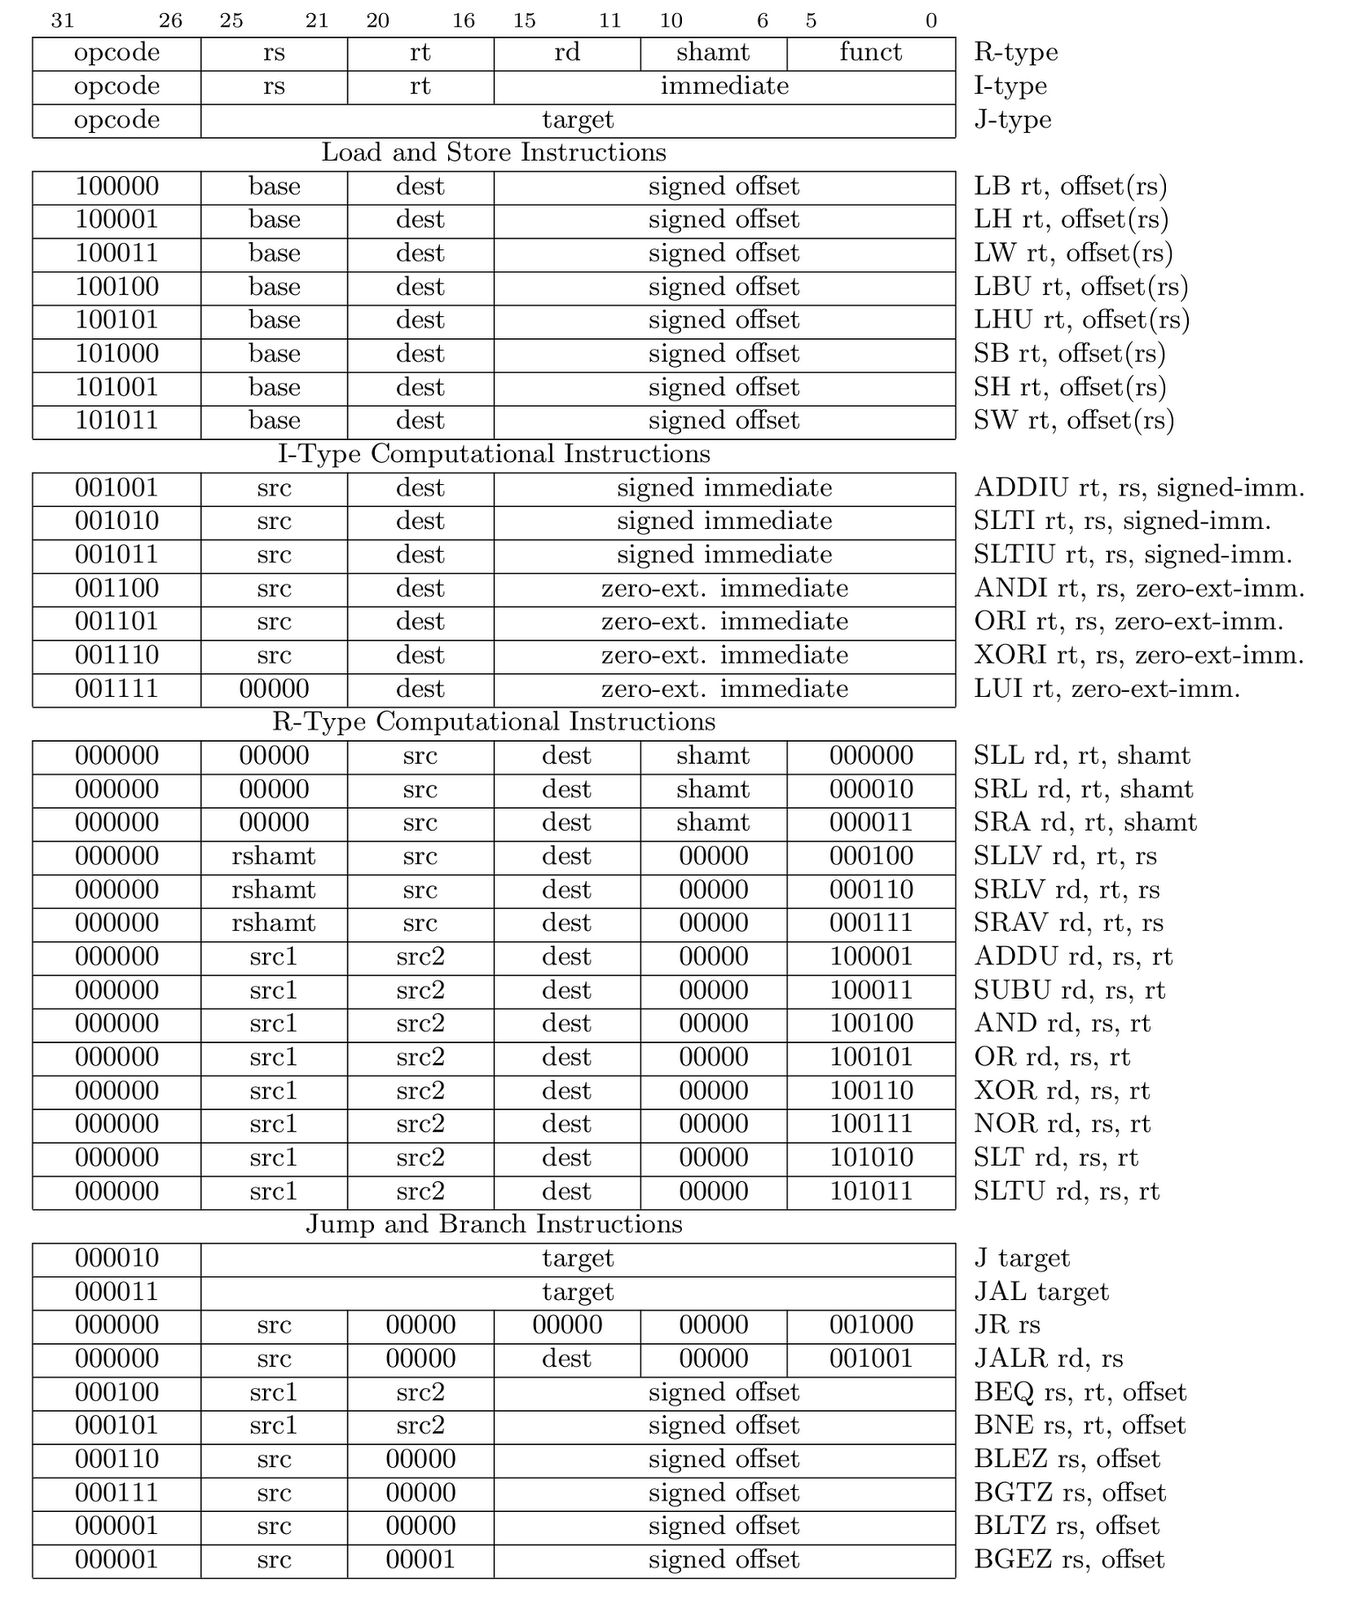
Your project will be to implement a processor that supports a subset of the MIPS ISA. Specifically, the instructions that your processor will need to support are outlined in the table below.
Before you get overwhelmed by the tables, remember that you will only be implementing the ALU and the ALU decoder for this lab. These tables are here for your reference. Also note that the ALU doesn’t need to do anything for branch and jump instructions (i.e., it can just output 0).
2.1.1 Functional Specification
The functionality of each instruction is shown below.
- R[$x] indicates the register with address x
- SEXT indicates sign extension
- ZEXT indicates zero extension
- BMEM indicates a byte aligned access to memory
- HMEM indicates a half word aligned access to memory
- WMEM indicates a word aligned access to memory
- PC indicates the memory address of the instruction
|
Mnemonic |
RTL Description |
Notes |
|
LB |
R[$rt] = SEXT(BMEM[(R[$rs]+SEXT(imm))[31:0]]) |
delayed |
|
LH |
R[$rt] = SEXT(HMEM[(R[$rs]+SEXT(imm))[31:1]]) |
delayed |
|
LW |
R[$rt] = WMEM[(R[$rs]+SEXT(imm))[31:2]] |
delayed |
|
LBU |
R[$rt] = ZEXT(BMEM[(R[$rs]+SEXT(imm))[31:0]]) |
delayed |
|
LHU |
R[$rt] = ZEXT(HMEM[(R[$rs]+SEXT(imm))[31:1]]) |
delayed |
|
SB |
BMEM[(R[$rs]+SEXT(imm))[31:0]] = R[$rt][7:0] |
|
|
SH |
HMEM[(R[$rs]+SEXT(imm))[31:1]] = R[$rt][15:0] |
|
|
SW |
WMEM[(R[$rs]+SEXT(imm))[31:2]] = R[$rt] |
|
|
ADDIU |
R[$rt] = R[$rs] + SEXT(imm) |
|
|
SLTI |
R[$rt] = R[$rs] < SEXT(imm) |
|
|
SLTIU |
R[$rt] = R[$rs] < SEXT(imm) |
unsigned compare |
|
ANDI |
R[$rt] = R[$rs] & ZEXT(imm) |
|
|
ORI |
R[$rt] = R[$rs] | ZEXT(imm) |
|
|
XORI |
R[$rt] = R[$rs] ^ ZEXT(imm) |
|
|
LUI |
R[$rt] = {imm, 16'b0} |
|
|
SLL |
R[$rd] = R[$rt] << shamt |
|
|
SRL |
R[$rd] = R[$rt] >> shamt |
|
|
SRA |
R[$rd] = R[$rt] >>> shamt |
|
|
SLLV |
R[$rd] = R[$rt] << R[$rs] |
|
|
SRLV |
R[$rd] = R[$rt] >> R[$rs] |
|
|
SRAV |
R[$rd] = R[$rt] >>> R[$rs] |
|
|
ADDU |
R[$rd] = R[$rs] + R[$rt] |
|
|
SUBU |
R[$rd] = R[$rs] - R[$rt] |
|
|
AND |
R[$rd] = R[$rs] & R[$rt] |
|
|
OR |
R[$rd] = R[$rs] | R[$rt] |
|
|
XOR |
R[$rd] = R[$rs] ^ R[$rt] |
|
|
NOR |
R[$rd] = ~R[$rs] & ~R[$rt] |
|
|
SLT |
R[$rd] = R[$rs] < R[$rt] |
|
|
SLTU |
R[$rd] = R[$rs] < R[$rt] |
unsigned compare |
|
J |
PC = {PC[31:28], target, 2'b0} |
delayed |
|
JAL |
R[31] = PC + 8; PC = {PC[31:28], target, 2'b0} |
delayed |
|
JR |
PC = R[$rs] |
delayed |
|
JALR |
R[$rd] = PC + 8; PC = R[$rs] |
delayed |
|
BEQ |
PC = PC + 4 + (R[$rs] == R[$rt] ? SEXT(imm) << 2 : 0) |
delayed |
|
BNE |
PC = PC + 4 + (R[$rs] != R[$rt] ? SEXT(imm) << 2 : 0) |
delayed |
|
BLEZ |
PC = PC + 4 + (R[$rs] <= 0 ? SEXT(imm) << 2 : 0) |
delayed |
|
BGTZ |
PC = PC + 4 + (R[$rs] > 0 ? SEXT(imm) << 2 : 0) |
delayed |
|
BLTZ |
PC = PC + 4 + (R[$rs] < 0 ? SEXT(imm) << 2 : 0) |
delayed |
|
BGEZ |
PC = PC + 4 + (R[$rs] >= 0 ? SEXT(imm) << 2 : 0) |
delayed |
2.1.2 ISA Encoding
2.2 Lab Resources
If you would like to be able to copy paste commands from this lab guide, first type the following command so that the % prompt in front of each command is ignored:
alias %=''
Grab the resources for this lab.
% wget http://inst.eecs.berkeley.edu/~cs150/sp12/lab3/lab3.tar.gz
% tar -xvzf lab3.tar.gz
2.3 Testing the Design
Before writing any of our modules, we will first write the tests so that once you’ve written the modules, you’ll be able to test them immediately. Another reason why you should write your tests first is that if you need to change your module design, you can always run it against your test to see if it still works. You should also understand the expected functionality of these modules before writing any code or tests.
There are a few approaches you can use to test your design. For this lab, you will only be testing two modules, so you will resort to unit testing. For the project, you will be expected to unit test your modules as well as write integration tests (i.e. assembly code) for the entire processor.
2.3.1 Verilog Testbench
One way of testing Verilog code is with testbench files. The skeleton of a testbench file has been provided for you in ALUTestbench.v. There are several important parts of this file to note:
- `timescale 1ns / 1ps - This specifies the reference time unit and the time precision. This means that every delay in the testbench is 1ns long and the simulation should be accurate up to 1ps.
- Clock generation is done with the code below. Since the ALU is actually only combinational logic, this portion is not necessary. You may treat it as a reference for when you need to write a testbench for a sequential circuit.
- The initial block to set the clock to 0 at the beginning of the simulation. You must start the clock at 0, otherwise you will be trying to change inputs at the same time the clocks changes and it will cause strange behavior.
- You must use an always block without a trigger list to cause the Clock to change by itself
parameter Halfcycle = 5; //half
period is 5ns
localparam Cycle = 2*Halfcycle;
reg Clock;
// Clock Signal generation:
initial Clock = 0;
always #(Halfcycle) Clock = ~Clock;
- task checkOutput; - this task encapsulates some Verilog that you would otherwise have to copy paste over and over. Note that it is not the same thing as a function (as Verilog also has functions). The exact specifications of a task can be found here.
- {$random} & 31'h7FFFFFFF - $random generates a pseudorandom 32-bit integer. We mask the result to get it into the appropriate range.
For these two modules, the inputs and outputs that you care about are opcode, funct, A, B and Out. Thus, to test your design thoroughly, you should work through every possible opcode and funct that you care about, and verify that the correct Out is generated from the A and B that you pass in.
The testbench generates random values for A and B and computes REFout = A + B. It also contains calls to checkOutput for load and store instructions, for which the ALU should perform addition. It will be up to you to write tests for the remaining combinations of opcode and funct. Remember to restrict A and B to reasonable values (e.g. masking them, or making sure that they are not zero) if necessary to guarantee that a function is successfully tested. Please also write tests where the inputs A, B, and the output are hardcoded.
2.3.2 Test Vector Testbench
An alternative way of testing is to use a test vector, which is a series of bit arrays that map to the inputs and outputs of your module. The inputs can be all applied at once if you are testing a combinational logic block, such as in this lab, or applied over time for a sequential logic block (e.g. an FSM).
You will write a Verilog testbench that takes the the parts of the bit array that correspond to the inputs of the module, feeds those to the module, and compares the output of the module with the output bits of the bit array. The bit vector should be formatted as follows:
[107:102] = opcode
[101:96] = funct
[95:64] = A
[63:32] = B
[31:0] = REFout
Open up the skeleton provided to you in ALUTestVectorTestbench.v. You need to complete the module by making use of $readmemb to read in the test vector file (named testvectors.input), writing some assign statements to assign the parts of the test vectors to reg’s, and writing a for loop to iterate over the test vectors. The syntax for a for loop can be found in ALUTestbench.v. $readmemb takes as its arguments a filename and a reg vector, e.g.:
reg [5:0] bar [0:20];
$readmemb(“foo.input”, bar);
2.3.2.1 Writing Test Vectors
Additionally, you will also have to generate actual test vectors to use in your testbench. A test vector can either be generated in Verilog (like how we generated A, B using the random number generator and iterated over the possible opcodes and functs), or using a scripting language. Since we have already written a Verilog testbench for our ALU + decoder, we will tackle writing a few test vectors by hand.
Testvectors are of the following format:
0:5 = opcode
6:11 = funct
12:43 = A
44:75 = B
76:107 = REFout
It’s the same as the format for the testbench (they have to match or it wouldn’t work!), Verilog indexes the bits backwards.
Open up the file sim/tests/testvectors.input and add test vectors for the following instructions to the end (i.e. manually type the 108 zeros and ones required for each test vector):
- SLT
- SLTU
- SRA
- SRL
We’ve also provided a test vector generator written in Python, which is a popular language used for scripting. We used this generator to generate the test vectors provided to you. If you’re curious, you can read the next paragraph and poke around in the file. If not, feel free to skip ahead to the next section.
The script ALUTestGen.py is located in sim/tests. All the methods to generate test vectors are located in the two Python dictionaries opcodes and functs. The lambda methods contained (separated by commas) are respectively: the function that the operation should perform, a function to restrict the A input to a particular range, and a function to restrict the B input to a particular range.
If you modify the Python script, run the generator again to make new test vectors (this will overwrite the file, so don’t do this if you have hand-written test vectors in the file!)
% python ALUTestGen.py
This will write the test vector into the file testvectors.input.
2.4 Writing the Verilog modules
For this lab, we’ve provided the module interfaces for you. They are logically divided into a control (ALUdec.v) and a datapath (ALU.v). The datapath contains the functional units while control contains the necessary logic to drive the datapath. You will be responsible for implementing these two modules. Descriptions of what each of the inputs and outputs of the module mean can be found in the top few lines of the files.
The ALU should take an ALUop and its two inputs A and B, and provide an output dependent on the ALUop. The operations that it needs to support are outlined in the Functional Specification. Don’t worry about sign extensions, they should take place outside of the ALU. The ALU decoder uses the opcode and funct to determine the ALUop that the ALU should carry out. You will find the case statement useful, which has the following syntax:
always@(*) begin
case(foo)
2’b00: // something happens here
2’b01: // something else happens here
2’b10, 2’b11: // you can have more than
// one case do the same thing
endcase
end
To make your job easier, the lab comes with two Verilog header files (Opcode.vh and ALUop.vh). They provide, respectively, macros for the opcodes and functs in the ISA, and macros for the different ALU operations. You can feel free to change ALUop.vh to optimize the ALUop encoding, but if you change Opcode.vh, you will break the testbench skeleton provided to you. You can use these macros in by placing a backtick in front of the macro name, e.g.:
case(opcode)
`ADDIU:
is the equivalent of:
case(opcode)
6’b001001:
2.5 Using Modelsim
Once you’ve written your testbenches as well as implemented the Verilog modules, you can now simulate your design. In this class, you will be using ModelSim, a popular hardware simulation and debugging environment. The staff have wrapped up the functionality that you will need from ModelSim in a Makefile. To simulate your design, you must first compile it and fix any syntax errors that arise:
% cd ~/lab3/sim
% make compile
Once you have your design compiling, you need to run some test cases. The build system looks inside the tests directory for test cases to run. Each test case is a .do file, which is a script in Tcl, a scripting language used by a variety of CAD tools. For the most part you don't need to worry about the details of Tcl; you will just be using it to issue commands directly to ModelSim. The following is the Tcl script that runs ALUTestbench.
set MODULE ALUTestbench
start $MODULE
add wave $MODULE/*
add wave $MODULE/DUT1/*
add wave $MODULE/DUT2/*
run 100us
The first line sets the value of the variable MODULE to ALUTestbench. Its value is referenced through the rest of the script as $MODULE. The start command tells ModelSim which Verilog module it should simulate.
The add command is interesting. By default, ModelSim doesn't collect any waveform information from the simulation. '*' is a shortcut for "anything", so these commands tell ModelSim to record the signals for all the signals in the testbench as well as the signals in DUT1 and DUT2.
Finally, the run command actually runs the simulation. It takes an amount of time as an argument, in this case 100us (100 microseconds). Other units (ns, ms, s) are possible. The simulation will run for this amount of time. In most cases this will serve as a timeout because your testbenches should cause the simulation to exit (using the $finish() system call) when they are done.
Let's try running the simulation. To run all of the cases in the tests directory:
% make
This will first recompile your design if needed, then run the simulation. Other commands that may be useful are:
- make clean: Sometimes you can accidentally cancel a simulation or otherwise cause make to believe that your simulation results are up to date even if they aren’t. If you’re in doubt, run this command before running make.
- make results/<testcasename>.transcript: When you have multiple testbenches in your project and you only want to run one of them.
You should see the output of simulation printed to your terminal. It will also be written to results/<testcasename>.transcript. You should see the one of the following lines in the output:
# FAIL: Incorrect result for opcode
000000, funct: 100011:
# A: 0xdbfa08fd, B: 0x318c32a8, DUTout:
0xaa6dd655, REFout: 0x559229ab
or
# ALL TESTS PASSED!
2.6 Viewing Waveforms
Now for the fun part. After simulation completes you can view the waveforms for signals that you added in your test case script. The waveform database is stored in .wlf files inside the results directory. To view them use the viewwave script included in the sim directory.
% ./viewwave results/alu.wlf
This will pop open a ModelSim window that shows you a hierarchical view of the signals that your simulation captured.
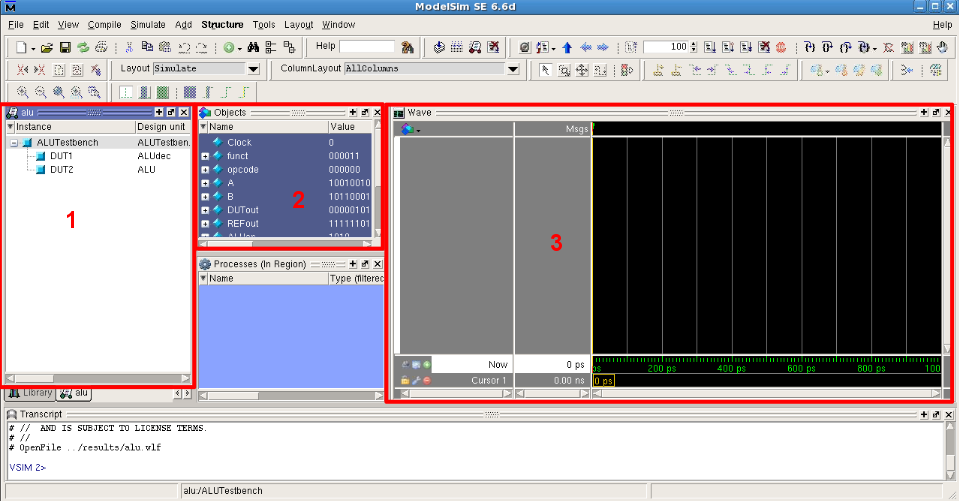
The above is a screenshot of ModelSim when you first open it. The boxed screens are:
- List of the modules involved in the testbench. You can select one of these to have its signals show up in the object window.
- Object window - this lists all the wires and regs in your module. You can add signals to the waveform view by selecting them, right-clicking, and doing Add > To Wave > Selected Signals.
- Waveform viewer - The signals that you add from the object window show up here. You can navigate the waves by searching for specific values, or going forward or backward one transition at a time.
As an example of how to use the waveform viewer, suppose you get the following output when you run ALUTestbench:
...
# PASS: opcode 000000, funct
000110
# A: 0x92153525, B: 0xb1f05664, DUTout:
0x058f82b3, REFout: 0x058f82b3
# FAIL: Incorrect result for opcode 000000, funct: 000011:
# A: 0x92153525, B: 0xb1f05664, DUTout:
0x058f82b3, REFout: 0xfd8f82b3
Yes, the $display() statement actually already tells you everything you need to know to fix your bug, but you’ll find that this is not always the case. For example, if you have an FSM and you need to look at multiple time steps, the waveform viewer presents the data in a much neater format. If your design had more than one clock domain, it would also be nearly impossible to tell what was going on with only $display() statements. Besides, you want to get some practice using ModelSim anyhow.
You add all the signals from ALUTestbench to the waveform viewer and you see the following window:
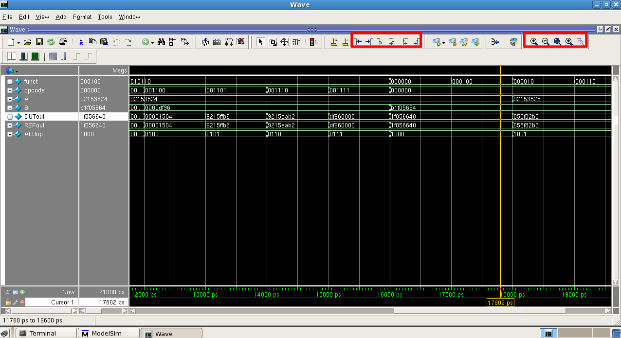
The two highlighted boxes contain the tools for navigation and zoom. You can hover over the icons to find out more about what each of them do. You can find the location (time) in the waveform viewer where the testbench failed by:
- Selecting DUTout
- Clicking Edit > Wave Signal Search > Search for Signal Value > 0x058f82b3
Now you can examine all the other signal values at this time. You notice that REFout has a value of 0xfd8f82b3. From the opcode and the funct, you know that this is supposed to be SRA instruction, and it looks like your ALU performed a SRL instead. However, you wrote
Out = B >>> A[4:0];
That looks like it should work, but it doesn’t! It turns out you need to tell Verilog to treat B as a signed number for SRA to work as you wish. You change the line to say:
Out = $signed(B) >>> A[4:0];
After making this change, you run the tests again and cross your fingers. Hopefully, you will see the line: # ALL TESTS PASSED!. If not, happy debugging!
3 Checkoff
Congratulations! You’ve written and thoroughly tested one of the blocks in your project and should now be well-versed in testing Verilog modules. Please answer the following questions to be checked off by a TA.
- In ALUTestbench, the inputs to the ALU were generated randomly. When would it be preferable to perform an exhaustive test rather than a random test?
- What bugs, if any, did your testbench help you catch?
- For one of your bugs, come up with a short assembly program that would have failed had you not caught the bug.